


LiquiTer NX
Web-based liquefaction analysis of saturated soils under seismic loading — from in-situ tests (SPT, CPT and shear-wave velocity Vs) to the factor of safety, the Liquefaction Potential Index and post-seismic settlements, layer by layer. Four calculation methods side by side, in the browser, aligned with NTC 2018 and Eurocode 8.
What it does
LiquiTer NX takes a soil column from in-situ tests and seismic parameters all the way to a full liquefaction assessment — the factor of safety against triggering at every depth, the Liquefaction Potential Index and the expected post-seismic settlement, with traceable NTC 2018 and Eurocode 8 reports, entirely in the browser.
Input from in-situ tests — SPT blow counts, CPT/CPTU tip resistance and shear-wave velocity (Vs) profiles, whichever your investigation provides.
Full soil-column model — layered stratigraphy, groundwater table, fines content and the total and effective vertical stresses computed down the whole profile.
Results at every depth — Cyclic Stress Ratio (CSR), Cyclic Resistance Ratio (CRR), the factor of safety against liquefaction (FSL), the Liquefaction Potential Index (LPI) and post-seismic settlement.
Four methods, side by side — Seed, Tokimatsu, Boulanger-Idriss and Andrus-Stokoe, chosen to match the test data you have.
Traceable deliverables — Word reports and CSV exports; your projects are saved to your own device as .json, not kept on our servers.
The calculation methods
Every method builds on the same seismic demand — the Cyclic Stress Ratio CSR = 0.65 · (a_max/g) · (σv/σ'v) · r_d — and differs in how it derives the soil's Cyclic Resistance Ratio (CRR) from your test data.
Seed (1971) — SPT
Derives CRR from corrected SPT blow counts (N₁,₆₀,cs) with the classic Seed semi-empirical curve — still the reference method in Italian practice.
Tokimatsu (1983) — SPT
Separate resistance curves for clean and silty sands driven by grain-size characterisation, useful when the sand classification is well constrained.
Boulanger-Idriss (2014) — CPT/CPTU
A continuous CRR profile from normalised cone resistance (qc₁N,cs), with fines-content corrections based on the soil-behaviour-type index Ic — the current international state of the art.
Andrus-Stokoe (2000) — Vs
CRR from the normalised shear-wave velocity (Vs₁,cs), ideal for gravelly or coarse sites where SPT and CPT are hard to drive.
Ishihara-Yoshimine (1992) — settlements
Post-seismic volumetric settlement of each liquefiable layer as a function of its factor of safety and relative density, summed to the total ground settlement.
Factor of safety, LPI and settlements
From demand and resistance, LiquiTer NX derives the verification at every depth and the whole-profile indices.
Factor of safety — FSL = (CRR · MSF · Kσ) / CSR, with the magnitude scaling factor MSF = (Mw/7.5)^-2.56 correcting for shaking duration and the overburden correction Kσ for confining pressure.
Triggering threshold — a layer is flagged as liquefiable when FSL falls below the limit — 1.25 for NTC 2018, 1.0 for Eurocode 8, or a conservative 1.5 you can set yourself.
Liquefaction Potential Index — the LPI integrates the factor-of-safety deficit over the top 20 m (Iwasaki), turning the whole profile into a single risk figure (0 = negligible, > 15 = high).
Post-seismic settlements — the expected volumetric settlement of each liquefiable layer, summed to the total ground settlement.
How it works
A guided flow takes you from project setup to an exported report in seven steps.
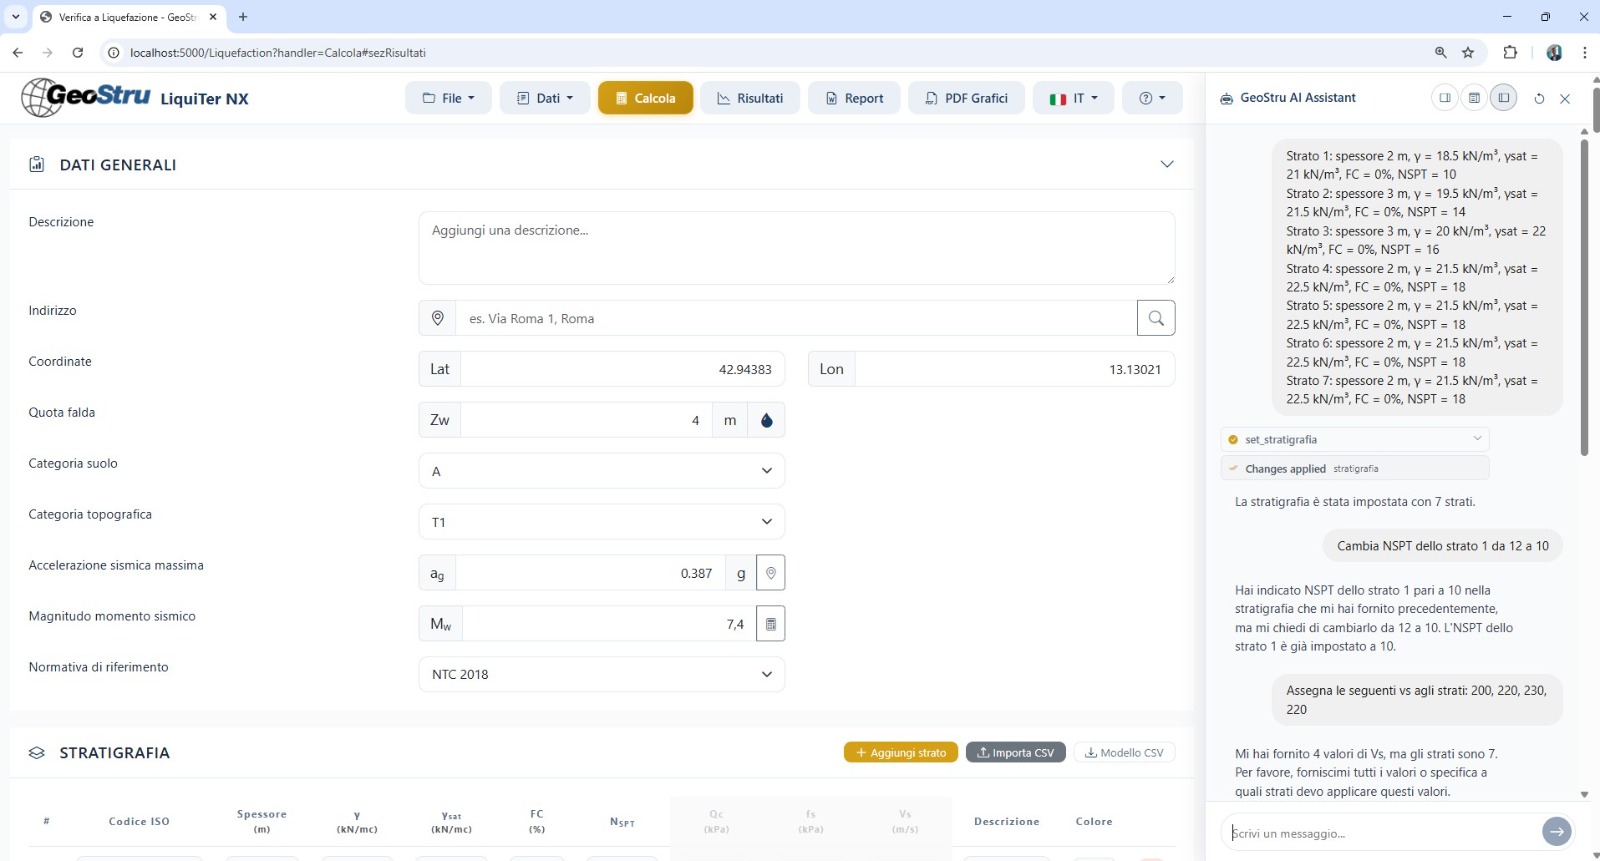
1 · Project data — description, operator and site; entering latitude and longitude geolocates the report and helps retrieve the seismic acceleration.
2 · Water table — the depth below which soils are saturated and liquefaction can occur; use a conservative value when uncertain.
3 · Seismic parameters — code (NTC 2018 or Eurocode 8), ground category (A–E from Vs,30), topographic category (T1–T4), peak ground acceleration ag and moment magnitude Mw.
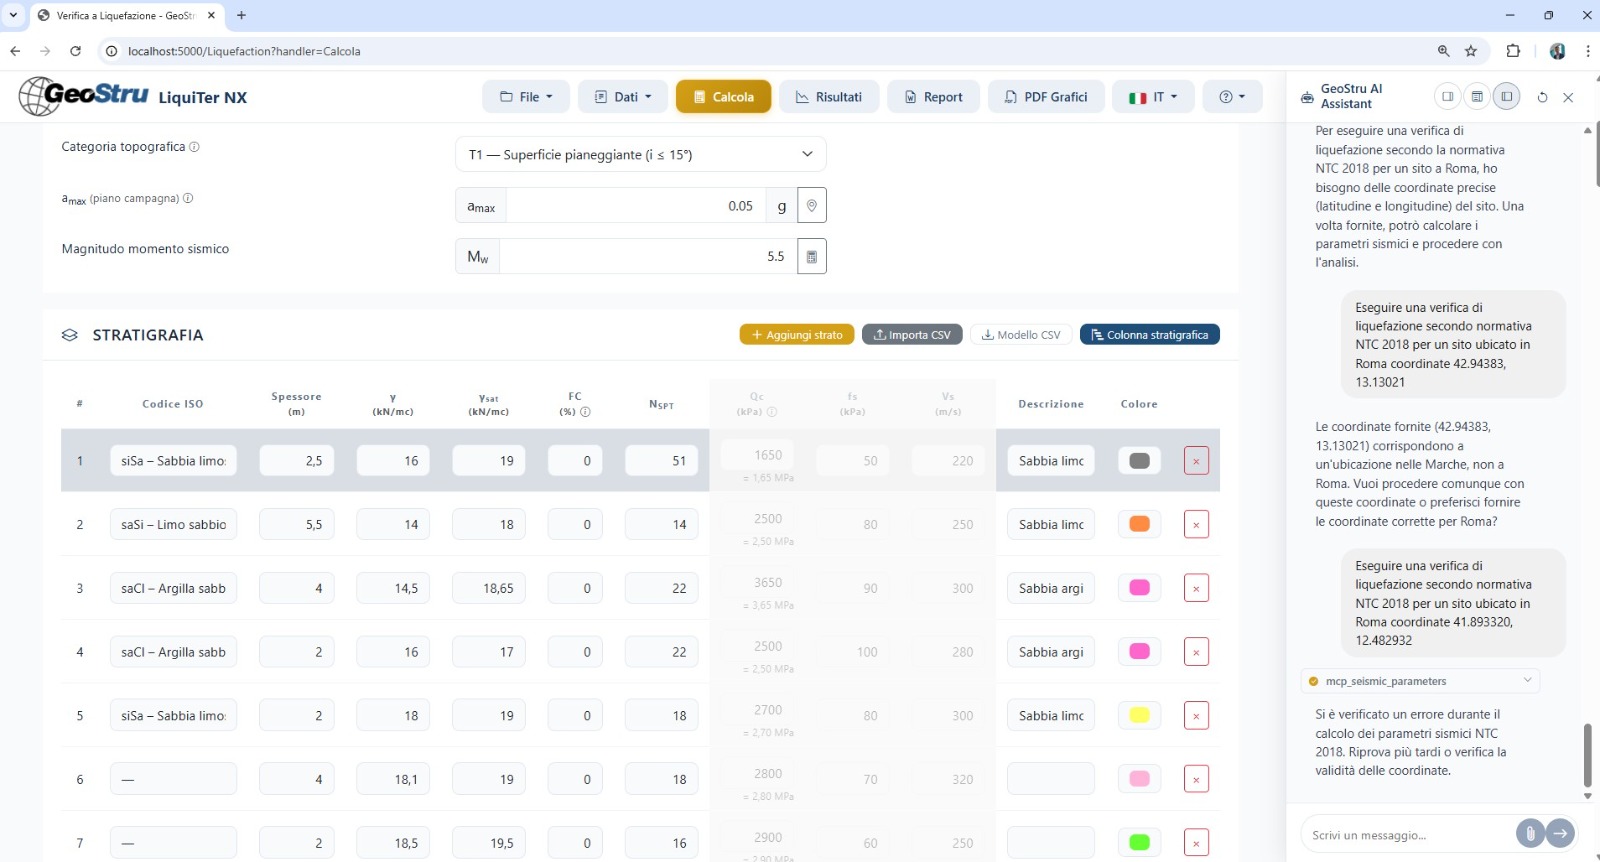
4 · Stratigraphy — each layer with its depths, lithology, unit weight γ, SPT N-value, CPT tip resistance qc, shear-wave velocity Vs and clay content.
5 · Method & calculation — pick the method that matches your data (SPT → Seed/Tokimatsu, CPT → Boulanger-Idriss, Vs → Andrus-Stokoe); the app computes the stresses, r_d, CSR, CRR, FSL and LPI.
6 · Results — a depth table (σv, σ'v, r_d, CSR, CRR, FSL with a colour-coded verdict), the FSL-versus-depth plot and the LPI risk index.
7 · Export — a Word report with figures and summary, or a CSV for further analysis.
Inputs and outputs
What you enter
In-situ tests — SPT, CPT/CPTU and/or shear-wave velocity Vs down the profile.
Stratigraphy & water — layer depths, lithology, unit weight γ, clay content and the groundwater table.
Seismic action — code, ground and topographic categories, peak ground acceleration ag and moment magnitude Mw.
What you get
Per-depth verification — CSR, CRR and the factor of safety FSL at every layer, with the liquefiable layers flagged.
Whole-profile indices — the Liquefaction Potential Index and the expected post-seismic settlement.
Charts — the FSL-versus-depth profile plotted against the chosen threshold.
Deliverables — a Word report and a CSV export, with the project saved to your device as .json.
Who it's for
Geologists · Geotechnical engineers · Seismic specialists · Consulting firms. LiquiTer NX is for anyone who assesses liquefaction susceptibility and triggering — for building and infrastructure foundations, seismic-zone construction and site-characterisation studies — and wants a single web environment that goes from in-situ tests to a fully verified, code-compliant assessment.
Why it's different
Runs directly in the browser — no installation, works on Windows, Mac and Linux, always up to date.
Four triggering methods (SPT, CPT and Vs) plus post-seismic settlements, side by side.
The full NTC 2018 and Eurocode 8 chain — CSR, CRR, FSL, LPI and settlements — traceable end to end.
FSL-versus-depth and LPI outputs that make the result immediate to read.
Your projects are saved to your own device as .json — calculations run encrypted server-side, and nothing is shared.
Word and CSV deliverables ready for the report.
Frequently asked questions
Can I use LiquiTer NX on clays?
No. Liquefaction concerns saturated sands and silty sands; clays with more than about 35% of particles finer than 5 µm are automatically excluded.
How much does the result change between Seed and Boulanger-Idriss?
In typical clean or silty sands the factor of safety differs by about 10–20%; Boulanger-Idriss tends to be more conservative in silty sands.
Why do some layers show FSL = 99?
That marks a non-liquefiable layer: above the water table, more than about 35% clay, deeper than 20 m, or with SPT blow counts too high to liquefy.
Where do I get ag and Mw for my site?
ag (NTC 2018) comes from the seismic-parameters service with your coordinates and return period; Mw is the maximum expected magnitude of the INGV seismogenic zone.
Does it work on a slope?
LiquiTer NX assumes horizontal ground; on a slope the static shear stress modifies the resistance, so the assessment no longer applies directly.
Is there a free plan?
Yes. The Free plan includes access, the full calculation and CSV export; a subscription adds the Word report, AI import, multi-site batch and priority support.
Ready to start with LiquiTer NX?
Choose your plan and start using LiquiTer NX today. Runs in the browser, always up to date, no installation required.