


Maps NX (Mapping, Elevations and CAD Export)
Web-based mapping for survey and preliminary design — locate the site, draw points, tracks and areas, sample ground elevations from the digital terrain model, derive section profiles and grids of elevation nodes, and export everything in the formats your CAD and GIS expect. Two interchangeable map engines, an AI assistant that drives the map for you, and a report-ready coordinate table. Opens in any browser — no installs, no hardware keys.
What it does
Maps NX covers the step that comes before the calculation: turning a place on the map into coordinates, elevations and a drawing your CAD can open.
Find the site — search by place name or address and the map centres there. Road, satellite and terrain base maps, switchable at any moment without losing what you have drawn.
Draw points, tracks and areas — single points, polylines and polygons, each vertex editable by dragging. Every vertex lands in the coordinate table with its id, latitude, longitude, elevation and running chainage.
Sample the ground elevations — on demand or automatically as you place each point, from the digital terrain model. The coordinate table fills in, and the elevation range appears alongside the distance and area measurements.
Two ways to a section — the profile of the points you clicked, or a proper georeferenced section resampled at a regular step along the drawn track. The second returns chainage, elevation and projected coordinates for every sample, together with the sampling step and the source of the elevations.
Grids of elevation nodes — a regular rows × columns mesh over the drawn area, each node given its elevation: the usual input for a surface model. The interface tells you the resulting node spacing in metres, so you can see at a glance whether the grid is finer than the terrain data underneath it.
Export in the format that fits — plain text, CSV, LLE (latitude/longitude/elevation), NEZ (north/east/elevation, projected to UTM), DXF with points and polylines as real CAD entities, GMT, and the section profile.
Projects in the cloud — save and reopen a survey from any workstation through GeoDropbox, with ready-made examples to start from and the working session preserved as you go. Interface in 7 languages (Italian, English, German, French, Spanish, Romanian, Danish).
What the elevations are — and what they are not
A number on a screen looks the same whether it is worth a centimetre or ten metres. It matters that you know which one you are holding.
Where they come from — the elevations are read from a digital terrain model of global coverage, typically on a grid of about 30 metres (SRTM / Copernicus class). They are ground elevations, not surface elevations: buildings and tree canopies are not represented.
What they are good for — feasibility studies, preliminary design, longitudinal profiles of an alignment, an initial surface for a volume estimate, the terrain input for a geotechnical model at the stage where the survey has not been commissioned yet.
What they do not replace — a topographic survey. Between two adjacent points a few metres apart the model has nothing new to say, and a grid finer than the terrain data adds nodes but no information. Maps NX shows the node spacing precisely so this stays visible rather than implied.
Every section carries its provenance — the source of the elevations, the sampling step and the number of samples travel with the profile. A section without its provenance cannot be defended in a report; this one can.
How it works
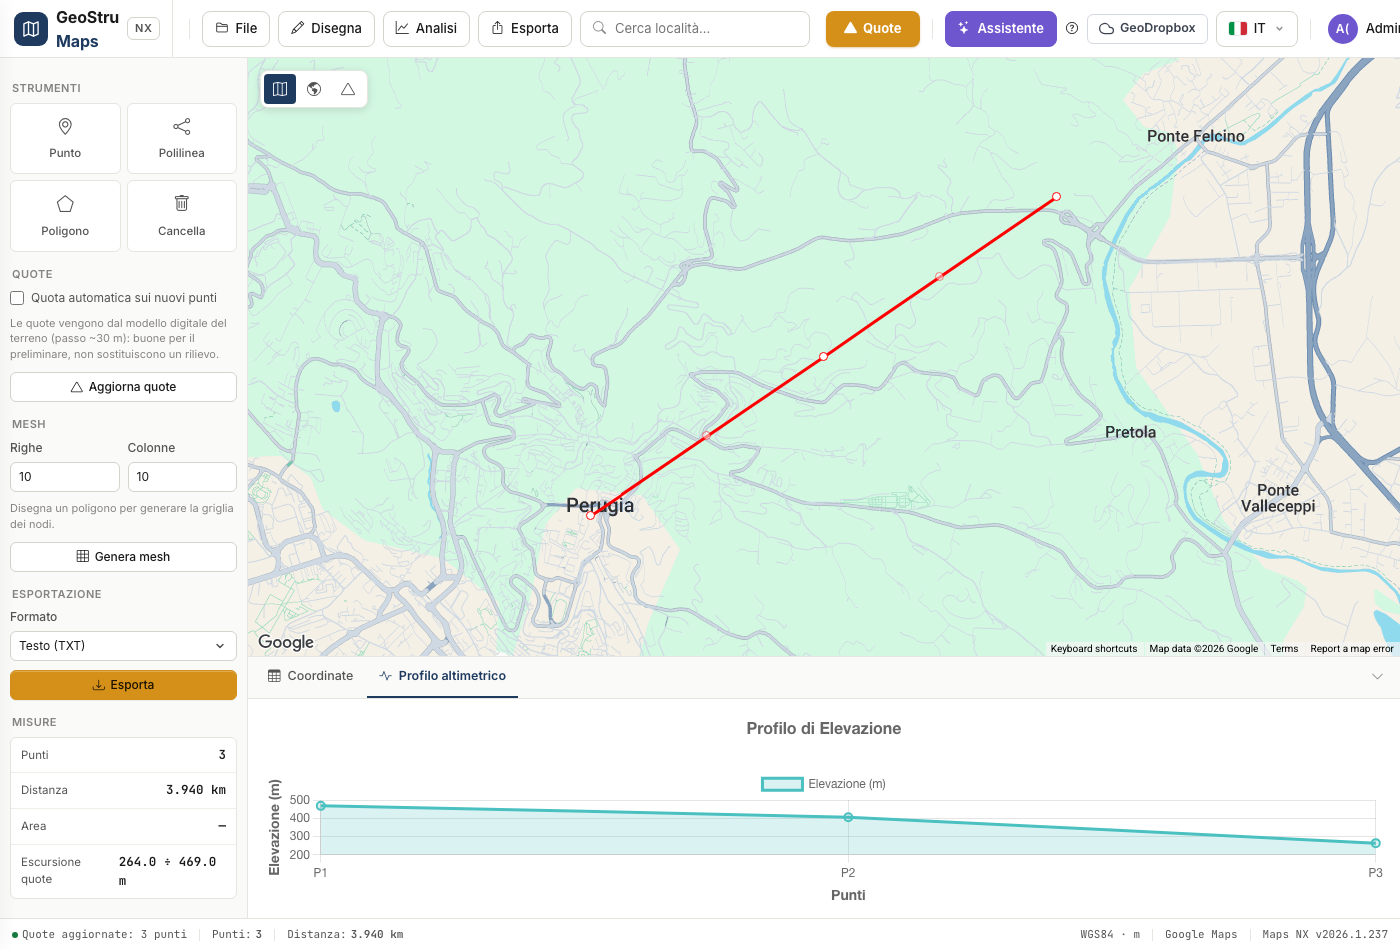
One page: the map fills the screen, the tools sit on the left, the data docks below.
1 · Locate — type a place or an address in the toolbar and the map flies there. Choose road, satellite or terrain as the base map.
2 · Draw — pick point, polyline or polygon and click on the map. While you draw, an elastic segment follows the cursor and the status bar counts the vertices; a double click or Enter closes the geometry, Esc cancels it, and on a polygon clicking the first vertex closes the ring.
3 · Elevations — one button fills the elevation column for every point on the map, or leave automatic sampling on and each new point arrives already with its elevation.
4 · Coordinates and profile — the dock below the map holds the coordinate table on one tab and the elevation profile on the other. Zoom to any point or delete it straight from the table.
5 · Mesh — set rows and columns over a drawn area and the grid of elevation nodes is generated, with the resulting spacing shown in metres.
6 · Export — choose the format and the file is produced; or save the whole survey to the cloud and reopen it later exactly as you left it.
An assistant that actually drives the map
Most built-in assistants explain where to click. This one clicks.
It operates the tools — ask it to take you to a place, to draw a track through a list of coordinates, to fetch the elevations, to build the mesh or to export in a given format, and it performs the action on the map — it does not merely describe it.
Import from a document — attach a list of coordinates, a track or a report containing a table of points, and the assistant extracts them and draws them. It converts degrees, minutes and seconds on its own, and when the column order is ambiguous it tells you which reading it assumed instead of guessing silently.
It reviews your data — ask it to check the survey and it looks for swapped latitude and longitude, elevations never actually fetched, spikes that are artefacts of the terrain model rather than terrain, duplicate vertices, and a grid too fine for the data underneath.
Support without leaving the app — a support ticket can be opened straight from the chat, with the context of what you were doing.
What you enter, what you get
What you enter — a place or an address to locate the site; points, tracks and areas drawn on the map, or a list of coordinates pasted or attached as a file; the sampling step for the section; the rows and columns of the grid; the export format and separator.
What you get — the coordinate table with latitude, longitude, elevation and running chainage for every vertex; total distance, area and elevation range; the elevation profile, from the points or resampled along the track with its provenance; the grid of elevation nodes; and the export file — TXT, CSV, LLE, NEZ projected to UTM, DXF with real CAD entities, GMT or the section profile — plus the cloud project you can reopen from any device.
Who it's for
Geologists and geotechnical engineers · Surveyors · Infrastructure and road designers · Hydrology and hydraulics technicians · Environmental consultants · Public-works offices. Maps NX is built for anyone who today opens a web map in one window, copies coordinates into a spreadsheet in another, and hand-builds the file the CAD needs in a third.
Why it's different
From the map to the CAD in one place — locating, drawing, sampling elevations and producing a DXF or a NEZ file happen in a single environment, without moving coordinates between a browser, a spreadsheet and a drawing program.
Two interchangeable map engines — the base cartography can be served by a commercial provider or by an open-data engine built on OpenStreetMap: the drawing tools, the coordinate table and the exports are identical either way, so the choice of supplier never traps your work.
Honest about accuracy — the resolution of the terrain model, the resulting node spacing and the source of every section are shown, not buried. You always know what the number in front of you is worth.
An assistant that performs, not just explains — it searches, draws, samples, meshes and exports on your behalf, and imports coordinates out of the documents you already have.
In the browser, with no installation — no setup, no hardware key, always up to date, and the survey follows you between workstations through the cloud.
Frequently asked questions
How accurate are the elevations?
They come from a global digital terrain model, typically on a grid of about 30 metres. They suit feasibility and preliminary design; they do not replace a topographic survey. The application states the resolution and the resulting grid spacing so the limit stays in view.
In what coordinate system do I get the data?
The map works in geographic WGS84 coordinates. The NEZ export and the DXF project to UTM, and the section profile carries the projected coordinates of every sample alongside the geographic ones.
Can I import a track I already have?
Yes. Paste or attach a list of coordinates, or hand a document containing them to the assistant, which extracts and draws them. Projects saved in the cloud reopen exactly as you left them.
What is the difference between the two ways of making a section?
The profile of the clicked points simply puts your vertices in chainage order. The section along the track resamples the drawn line at a regular step, so the profile follows the terrain between the vertices instead of jumping from one to the next — and it carries its sampling step and elevation source with it.
How fine should the grid be?
No finer than the terrain data underneath. Maps NX shows the node spacing in metres as you change rows and columns: once it drops well below the resolution of the model, the extra nodes carry no new information.
Does it open the DXF in my CAD?
The DXF export writes points and polylines as real entities, not as an image, so they can be edited, snapped and referenced like any other drawing.
How is it billed?
Maps NX runs on GeoStru NX credits: you buy a credit package and each chargeable action draws from it. If the action fails, nothing is charged.
Ready to start with Maps NX?
Choose your credit package and start using Maps NX today. Runs in the browser, always up to date, no installation required.
AI-generated content